Introduction
The Resources screen offers a comprehensive 360-degree view of all the resources available in your IT environment. It provides dynamic monitoring of your entire infrastructure, including network devices, services on cloud or dedicated servers, and containers in orchestrated setups.
The system is designed to help modern operations teams by collecting data from managed resources in real-time. The data collection allows the teams to keep an eye on the resources round the clock everyday.
Access to the Resource Details screen requires the Device_View permission.
The following additional permissions are required view a screen or to perform specific actions:
| Functionality | Permission | Functionality | Permission |
|---|---|---|---|
| ALERTS Count | View Alerts | TICKETS Count | View Service Desk |
| PATCHES Count | View Patch Approval | NOTES Count | View Device |
| ANTI-VIRUS | View Device | SCHEDULES | View Scheduled Maintenance |
| ACTIONS - Edit | Edit Device | ACTIONS - ReSync | Manage Device |
| ACTIONS - Assign Custom Attributes | View Custom Attributes, Edit Device | ACTIONS - Assign Credential | View Credentials, Manage Device |
| ACTIONS - Unmanage | Manage Device | ACTIONS - Add Note | Edit Device |
| ACTIONS - Copy Id | View Device | ACTIONS - Delete | Manage Device |
| ACTIONS - Execute Command | Allow to Run Commands, View Scripts | ACTIONS - Launch Remote Console | Remote access management, View Console Launch, View Device |
| ACTIONS - Add Maintenance Window | Manage Scheduled Maintenance | ACTIONS - View Logs | Logs View |
| OVERVIEW Tab | View Device | METRICS Tab | View Metrics |
| METRICS Tab - TEMPLATES | View Monitors, View Metrics | ATTRIBUTES Tab | View Device, View Custom Attributes |
| COMPONENTS Tab | View Device | INVENTORY Tab | View Device |
| RELATED INFO - ARTICLES | View Knowledge Base | RELATED INFO - CREDENTIALS | View Credentials |
| RELATED INFO - ARTICLES (assign / unassign) | Manage Knowledge Base | RELATED INFO - CREDENTIALS | View Credentials |
| RELATED INFO - AUDIT RECORDINGS | Play, Search All Recordings | RELATED INFO - SCRIPTS ACTIVITY | View Scripts |
| RELATED INFO - EXTERNAL RESOURCE IDs | View Integration | Availability TimeLine | View Metrics |
| Group By Alerts | View Alerts |
Navigation: Follow these steps to navigate to resource details screen.
- To select your client, click the Client/Partner dropdown menu.
Note: You may either type your client’s name in the search bar or select your client from the list. - Click Infrastructure → Search.
- You can either select a resource from the categories or use the search icon to search for resource.
- Click resource name. In the RESOURCE slide-out, click resource name or click the three dots icon and select View Details. The resource details screen is displayed.

Resource screen layout
The Resources screen is divided into the following sections:
| Callout | Section | Description |
|---|---|---|
| 1 | Header | The Header consists of MY RESOURCE VIEWS menu, Home Tab, and Search icon. |
| 2 | Summary View | Includes basic resource information like resource name, IP address, resource type, Model, Operating System. |
| 3 | Detailed information | Contains resource properties in a tabbed structure. This allows you to navigate between different property sections and view detailed information about the resource. |
The following sections provide a detailed description of the resource properties:
Header
The Header consists of MY RESOURCES VIEWS menu, Home Tab, and Search icon.
MY RESOURCE VIEWS: Use the MY RESOURCE VIEWS menu to add resources manually, Download resources. You can Add current view, Rename, Copy, Set Default View, Share, Move view, Set Favorite, and Remove views.
For more information, see Views.Home Tab: The Home Tab shows a summary of all the resources in your IT environment. It allows you to manage the performance of your infrastructure.
See Resources Home Tab for more information.Use the search icon to search for resources. See Advanced Search to know how to build queries using OpsQL.
Option Description MY RESOURCE VIEWS Use the MY RESOURCE VIEWS menu to add resources manually, Download resources. You can Add current view, Rename, Copy, Set Default View, Share, Move view, Set Favorite, and Remove views. Home Tab The Home Tab shows a summary of all the resources in your IT environment. It allows you to manage the performance of your infrastructure. Search icon Use the search icon to search for resources.
Summary View
Displays the following resource information:
Field Description Resource name Name of the resource. Availability state Availability state of the resource.
Example: Undefined, Down, Unknown, Up, Undefined.LAST MONITORED Displays the date and time the resource was last monitored. Managed and Discovered by (displayed based on the resource type) Managed by Collector type like Agent, Gateway. Discovered by integration. IP Address IP address of the resource. Resource Native Type Native type of the resource. Model Model of the resource. Operating System Operating System of the resource. UUID Resource UUID information ALERTS count Count of critical and warning alerts on the resource. Click the count to navigate to Alerts listing page. TICKETS count Count of tickets on the resource. Click the count to navigate to Tickets listing page. PATCHES count Count of patches on the resource. Click the count to navigate to PATCHES listing page. Note
Scenario 1: If a missing patch is manually installed on the device via command line and again tried to install from OpsRamp portal, then the patch will appear in the Installed list within the portal and display ‘Installed By’ as Automatic/Manual Update. It indicates that the installation was performed outside of the OpsRamp portal.
Scenario 2: If a missing patch is installed manually on the device via command line and then the Missing Patches Scan Job is run in the OpsRamp portal, the patch will no longer appear in the Missing list. Additionally, it will not be shown in either the Missing or Installed count lists in the portal, as it has already been resolved on the device.
NOTES count Count of notes assigned to the resource. Click the count to navigate to NOTES screen, from which you can view, search, edit, and remove note(s). ANTI-VIRUS Provides anti-virus related information (active or outdated) and additional details about the anti-virus. SCHEDULES Displays scheduled maintenance information.
Click VIEW ALL to view the list of active maintenance windows. You can add maintenance windows, view pending, suspended, and completed windows.ACTIONS Perform actions on resource like Add Maintenance Window, View Logs, Edit, Delete, Re-sync, Unmanage, Execute Command, Launch Remote Session, Assign Custom Attribute, Assign Credential, Add Note, Copy ID.
For more information, see Resource actions.Note: Based on the resource type, some information in Summary View will vary.
Example: For synthetic resource type, information like Discovered by, Up/Down Since, Response Time, Locations, URL is displayed.Detailed information
Displays the resource properties in tab structure:

OVERVIEW: Displays basic information about resource attributes and AVAILABILITY TIMELINE.
The AVAILABILITY TIMELINE provides a visual representation of the availability states over a specified period.
- Hovering over the Availability Timeline displays the following information in a tooltip. This includes:
- State: Availability state (UP, DOWN, UNKNOWN, UNDEFINED).
- Total Time: Duration (in Hours, Minutes, Seconds) the resource has been in this particular state.
- Start Date and Time: The exact date and time when the resource entered this state.
- End Date and Time: The date and time when the resource exited this state.
The AVAILABILITY STATES (Up, Down, Unknown, Undefined) are also shown as percentages, indicating the proportion of time the resource has been in each state during the monitored period.
The AVAILABILITY METRICS button displays the availability metrics on a resource.
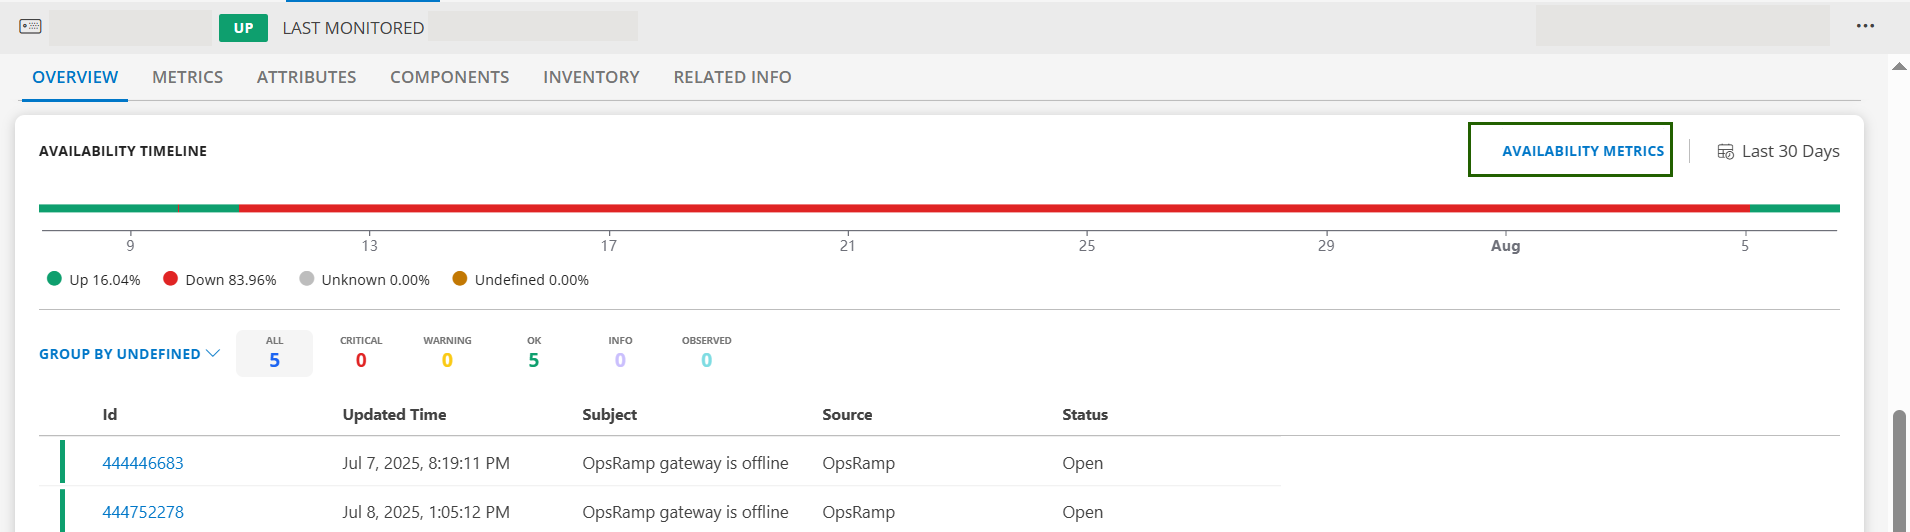
Note
The Availability Metrics page does not display the template-component level threshold configuration. It only displays the templates, resource, or resource component level threshold configurations. Alerting will continue to work as per the order. See the priority table in View Monitoring Configuration page.A list of alerts with their states like CRITICAL, WARNING, OK, INFO, OBSERVED is displayed. By default, the information is displayed for the past 4 hours. Use the calendar icon to change the date range to Last 8 Hours, Last 12 Hours, Last 30 Days, and so on.
- To view detailed attributes information, click SHOW ALL. It will navigate to ATTRIBUTES tab.
Display of Resource Monitored Data: The monitored data of the device(s) is presented in various locations in OpsRamp, allowing you to access information easily. The data that is monitored within the past week is shown with the most recent timestamps and values.
The Last monitored time is displayed next to the host name, in the Summary View section.
Other place where the Last monitored time is displayed:
- View the Last monitored time on the Resources > OVERVIEW screen.
Navigate to Infrastructure > Resources > OVERVIEW.

The Resource overview screen displays the values based on the below scenarios:
View Last Monitored Time
The last monitored time of a device is shown only for the past one week.
| Callout | Scenario/Description | Value |
|---|---|---|
| 1 | Device was created within the past one week and it is monitored successfully. | Last updated value (Date and Time). |
| Device was created more than a week ago and it is monitored successfully. | Last updated value (Date and Time). | |
| Device was created within the past one week and it is not monitored. | Empty | |
| Device was created more than a week ago and it is not monitored. | Data not available for more than a week. |
METRICS: This section displays graphical representation of the performance of the metrics.
- Warning and Critical Threshold Indicators: The warning and critical threshold of a resource is indicated by a red dotted line, as shown in the image below:


- Synchronize Tooltip (toggle switch): This toggle switch, when enabled, synchronizes tooltips across metrics. When enabled, it ensures that all tooltips display the same information or are aligned when hovering over multiple metrics. This is helpful for comparing data across different metrics at the same point in time or other shared criteria.
Note
The tooltip displays a limited number of metric values. Switch to full screen mode to see all of them.


Size (L/S): This option allows you to adjust the size of the graphs. “L” stands for Large and “S” for Small. Selecting Large will display the graphs in large size, while selecting Small will display the graphs in small size.
Metrics dropdown: This dropdown lists the metrics. The number in brackets indicates the total number of available metrics.
- Clicking this dropdown will open a list where you can choose or filter which metrics to show.
- Clicking Select All or Deselect All will select all metrics or deselect all metrics respectively.
Date/Time Range: The top right corner of the tile shows Last 4 Hours, which indicates the selected time range for the displayed data.
You can click on this option to change the time range to a different period (Last Day, Last 7 Days, etc.) The data is displayed accordingly.
Note: The time range is applicable for all the tiles in the METRICS screen.
To view metric data for a custom date range for a specific tile, see Tile Actions for more information.
Assign Templates: You can assign monitoring templates to the resource from METRICS section.
See View Monitoring Configuration for more details.
Tile Actions
Follow these steps to navigate to the tile action options:
- On the Infrastructure resource details screen, click the METRICS tab. The metrics graphs associated with the resource are displayed.

- Click the three horizontal dots (menu) available on the tile. A popup menu is displayed.

You can perform the following actions on a tile:
| Option | Description |
|---|---|
| Refresh | Reload the tile to get the latest metric data series. To refresh a tile:
|
| Full screen | Expand the tile for a detailed view. To view full screen:
|
| Custom date range | Choose a specific date range. The tile updates to display data for the selected period. To select a specific date range:
 |
| Add to Dashboard | Pin this tile to your dashboard for quick access. To add a tile to the dashboard:
 The Widget Title name is displayed by default. It is a combination of host name and metric name. You can modify the title as required. |

Note
The Export CSV option is not supported in Dashboard 2.0.Data aggregation options
You can use the following data aggregation options to control how the data is displayed in the graph:
- RAW: Displays the unprocessed, real-time, or original data points as they are collected. No aggregation is applied.
- AVG: Shows the average of the data points over a specific time interval. Helps smooth out fluctuations.
- MIN: Displays the lowest recorded value in each time interval.
- MAX: Displays the highest recorded value in each time interval.
If you are investigating anomalies, RAW data is best, while AVG, MIN, and MAX help summarize trends over time.
Follow these steps to navigate to these options:
- On the Infrastructure resource details screen, click the METRICS tab. The metrics graphs associated with the resource are displayed.
- Click RAW on the tile. A popup is displayed with other options like AVG, MIN, and MAX.

- Select each option to view how metric data is displayed in the tile.
ATTRIBUTES: This section is divided into three categories:
GENERAL ATTRIBUTES, DOMAIN ATTRIBUTES, and CUSTOM ATTRIBUTES.
GENERAL ATTRIBUTES: This section contains resource information like Resource Type, Operating System, First Created Time, Agent Last Connected Time, Resource UUID, Agent Connectivity, Resource Name, Host Name, IP Address, Make, Model, Description, Serial Number.
- Use the search icon to search for the fields.
- Use the search icon to search for the fields.
DOMAIN ATTRIBUTES: Contains information like DomainName, RAM, powerState, registeredUser, productKey, deployment, agentInstalledDirectory.
Note: If an attribute does not have any value, the attribute is not displayed in the DOMAIN ATTRIBUTES section.CUSTOM ATTRIBUTES: Lists the custom attributes assigned to the resource. Information is displayed in a tabular format with columns including Name, Value, Scope, Source, Metric value, Log Label, Authz Tag, and Alert Tag:
- Name: The name of the custom attribute assigned to the resource.
- Value: The actual value assigned to the attribute.
- Scope: Defines the level at which the attribute is applied (e.g., Partner, Client).
- Source: Indicates where the attribute originated from (e.g., OpsRamp,OpsRamp, AWS, Azure, Google, Kubernetes, Mesosphere, Docker, APP, VMWare, Meraki.)
- Metric Label: A tick mark indicates that the custom attribute value assigned to the resource can be used in metric-based queries and visualizations.
- Log Label: A tick mark indicates that the custom attribute value assigned to the resource can be used to filter or group log data in log-based queries and views.
- Authz Tag: A tick mark indicates that the custom attribute value assigned to the resource can be used to enforce access controls based on role permissions.
- Alert Tag: A tick mark indicates that the custom attribute value assigned to the resource can be used to enrich alert metadata. This enables more effective filtering, grouping, and correlation of alerts during incident investigation.
You can perform actions like assign, edit and unassign custom attributes on this screen.
- Assign custom attributes: You can assign custom attributes from this section.
- Click ASSIGN.
- Select custom attribute name and value from the Name and Value dropdowns.
- Click ASSIGN CUSTOM ATTRIBUTE. The custom attribute is assigned to the resource and a confirmation message appears.
- Edit Attribute details: Follow these steps to edit attribute details:
- Hover over the custom attribute name and click edit icon.
- Select a value from the dropdown and click SAVE.
- Unassign custom attributes: Follow these steps to unassign custom attributes:
- Select checkboxes next to the custom attribute name(s) and click UNASSIGN.
The custom attribute(s) are unassigned from the resource and a confirmation message appears.
- Select checkboxes next to the custom attribute name(s) and click UNASSIGN.
COMPONENTS: Displays all the relationships associated with the resource.
The above image displays the list of components that are related to the resource, with their availability state.
The information that is shown in COMPONENTS section is displayed in a tabular format. The following table describes the details:
| Column | Description |
|---|---|
| Name | Name of the component that is related to the resource. |
| Native Type | Native Type of the component. |
| Type | Type of the component. Example: Server, VMware Host. |
| IP Address | IP Address of the component. |
| OS | Operating System of the component. |
| Make | Make of the component. |
- Click the component name to get component details information.
INVENTORY: This section has five tabs: HARDWARE, DISKS, NETWORK, SERVICES, AND SOFTWARE.
HARDWARE: This tab has resource hardware details like PHYSICAL COMPONENTS AND SOFTWARE MODULES, BIOS, CPU, and VIDEO CARDS.
DISKS: This tab has resource logical disk drives and physical disk drives information.
NETWORK: This tab provides details about all network interfaces on the device, including both standard interfaces. It lists each interface along with operational details such as Name, Type, MAC address, Transmission Mode, and Configured Speed.
Following table describes the columns under the INTERFACES tab:
Column Description Name The interface identifier as recognized by the system. Clicking the name displays the interface metric graphs. Alias Name An optional user-defined label. Useful for naming interfaces based on function. Type The classification or role of the interface. Transmission Mode Shows the data transmission type. MAC Address Unique hardware address assigned to the interface. Configured Speed The speed the interface is configured to operate at. 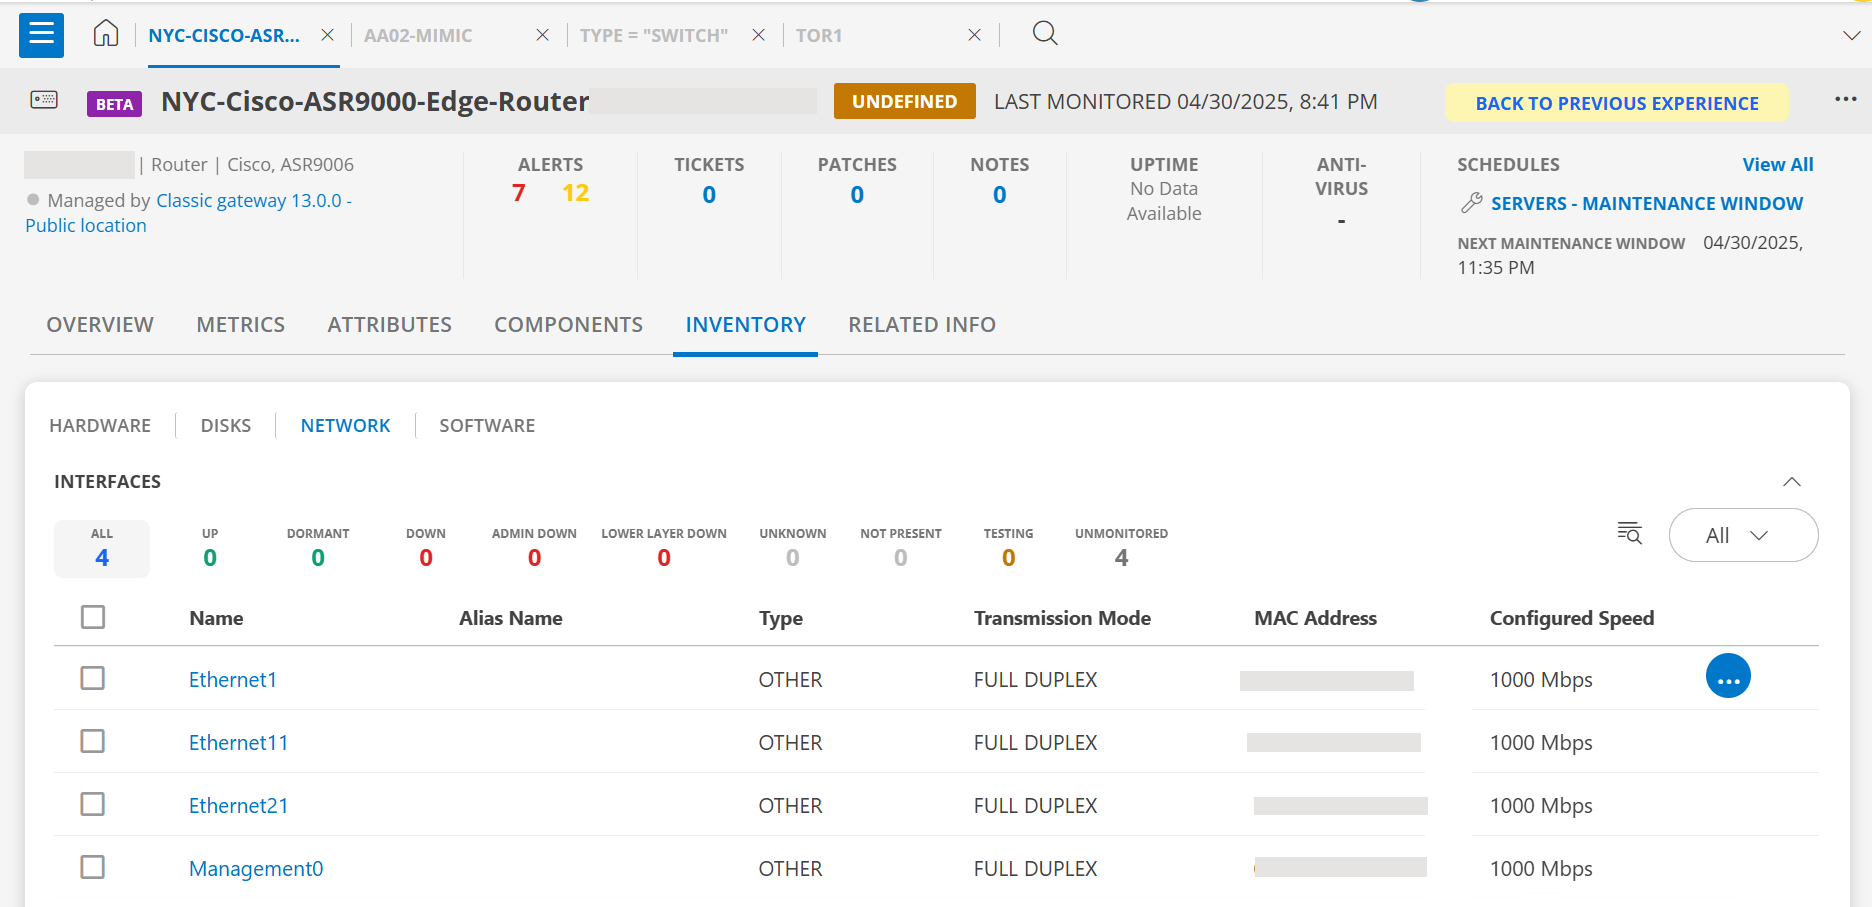
The following permissions are required to view Network tab:
Category Permission Type Permission Value Account Administration Devices View The following permissions are required to update speed for network interface:
Category Permission Type Permission Value Account Administration Devices Edit SERVICES: The Services tab provides detailed visibility into the system services running on a device.
It allows you to track, monitor, and manage services across all monitored devices, to ensure critical services are running as expected and enabling quick response to service-related issues. 
Following table describes the columns under the SERVICES tab:
Column Description Display Name The friendly name of the service (e.g., Adobe Acrobat Update Service). Service Name Internal system name. Service Mode Indicates how the service is set to start: - Manual: Starts only when needed.
- Auto: Starts automatically with the system.
Logon As Account used to run the service.
Example: LocalSystem, NT Authority\LocalService, etc.Monitored Indicates whether the service is being actively monitored by the system. - true: Actively being monitored.
- false: Not actively being monitored.
Service Status Shows whether the service is RUNNING (green) or STOPPED (grey). Click the search icon and enter a service’s Display Name to retrieve its information.
SYNC LATEST DATA: Click to get the most recent service data from the monitored device.
Note: Agent should be running on the device to get the information.REFRESH: Click to reload the current screen.
To start or stop a service, hover the mouse over the service and click the start/stop icon.
Note: You cannot start a service, if it is disabled.
Following are the permissions required to access the Services tab:
Category Permission Type Permission Value Account Administration Devices View
and
Access to all resources.Following are the permissions required to start or stop a service:
Category Permission Type Permission Value Remote Access Commands Allow to Run SOFTWARE: This tab lists the installed softwares on the resource.
RELATED INFO: Based on the resource type, different tabs are displayed in this section. Below are the commonly available tabs:
- GROUPS, ARTICLES, CREDENTIALS, AUDIT RECORDINGS, SCRIPTS ACTIVITY, EXTERNAL RESOURCE IDs, DEPENDENCIES.

GROUPS: Displays the Resource Groups and Service Groups associated with the resource.
- To get resource group details, click the resource group/service group name.
Following are the permissions related to access Resource Groups information:
Category Permission Type Permission Value Account Administration Devices View
and
Access to all resources.Note: The above is applicable to both Partner and Client users.
- To get resource group details, click the resource group/service group name.
ARTICLES: The ARTICLES tab is divided into three sections:

DEVICE ARTICLES: Articles that are assigned to the device are displayed in this section.
GROUP ARTICLES: All the articles associated with the resource through a resource group are displayed in this section.
- Click the Group article Id. The article details are displayed in another browser tab.
- Click the Group article Id. The article details are displayed in another browser tab.
MONITOR ARTICLES: All the articles linked to a monitor within a template will automatically appear in this section when the template is applied to the resource.
- Click the Monitor article Id. The article details are displayed in another browser tab.
DEVICE ARTICLES
You can search, assign, view, filter, and unassign articles in this section.
Search Article: You can search article(s) by Subject or Category.
Follow these steps to search for an article:- Click the search icon in the DEVICE ARTICLES section.
- Enter the subject or category in the search box.
- The search result is displayed.

View Article(s): You can view the information related to an article. Follow these steps to view article details:
- Search for the article(s).
- Click Article ID. The article details are displayed in another browser tab.
Assign Article(s): You can assign article(s) to the resource.
Follow these steps to assign an article:- Click +ADD. The ARTICLE FILTER window is displayed.

- Search for the article(s).
- Select the article(s) and click ASSIGN. The articles are assigned and a confirmation message appears.
- Click +ADD. The ARTICLE FILTER window is displayed.
Filter: Use the filter option to filter article(s).
Follow these steps to filter article(s):- Click +ADD in the DEVICE ARTICLES section. The ARTICLE FILTER window is displayed.
- Click Filter. The Filters popup dialog box is displayed.

- Enter values in one or more fields to refine your search and click APPLY. The articles are filtered and displayed.
Following table describes the fields in the Fields popup window:
Field Description Article ID Unique identifier assigned to each article. Subject Subject of the article. Search for article(s) by entering part or all of article's subject. Keyword Match Enter a keyword or phrase in the box. The system will look through the content of all articles and return those that include that keyword. Expiration within Select an option: Week, Two weeks, One month.
This will fetch articles that are set to expire within a certain time frame. This filter helps you identify those articles ahead of time.
Example: If you select Week, the system will show all articles that are scheduled to expire within the next 7 days.
If you are cleaning up or reviewing soon-to-expire content, you can use this filter to quickly find articles that need updates or removal.Unassign article(s): You can unassign article(s) from the resource.
Follow these steps to unassign article(s):- Search for the articles and select the checkboxes next to them.
- Click UNASSIGN. The article(s) are unassigned and a confirmation message appears.
See Knowledge Base for more information.
- Click the Monitor article Id. The article details are displayed in another browser tab.
CREDENTIALS: Displays the list of credential(s) assigned to the resource.
- You can add credential(s) to the resource.
- You can unassign credential(s) from the resource.
AUDIT RECORDINGS: Displays the list of audit recordings.
SCRIPTS ACTIVITY: Displays script related information.
EXTERNAL RESOURCE IDS: This tab shows metadata that links this OpsRamp resource to its corresponding identity in an external system or integration.

- Installed App Name: Name of the third-party tool or integration.
- External ID: A unique identifier for the resource from the third-party system.
The following permissions are required to access the External Resource IDs tab:
Category Permission Type Permission Value Account Administration Devices View
and
Access to all resources.